|
Introduction
¬Ý¬Ý As it has been reported several times on GEMMOLOGY (please refer to the issues of June 2004, February 2005 and November 2008), lead glass filled corundum has been widely spread these years. Lead glass filled ruby has now been reportedly circulated in the market and AGL released an emergency report to alert the industry in October 2008. The durability of the lead glass filled ruby was discussed comprehensively in the Gems & Gemology, Spring 2006, together with its resistance to a variety of chemicals, although there was no discussion on the influence of the filled lead-glass on the stone weight. Our laboratory obtained lead glass filled ruby cabochons in the weight of between 3 to 5.5 carats currently circulated on the market (figure 1), which were tested in immersion in two types of acid with different acidity to observe any change on their appearance and study the weight change.
 |
|
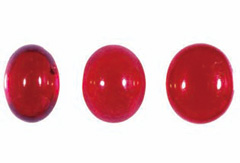
fig-1:
|
Ruby with significant fissure filling with lead-glass (from left; 5.003 ct (A1), 4.862 ct (B1) and 5.492 ct (C1))
|
|
|
|
|
|
Samples
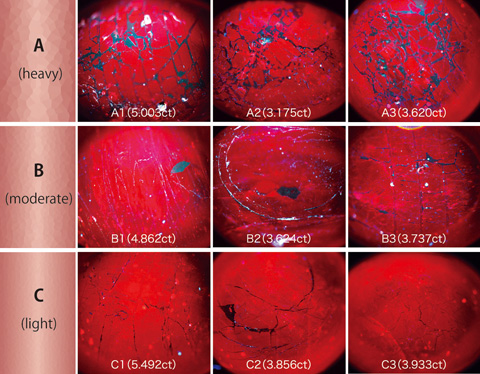
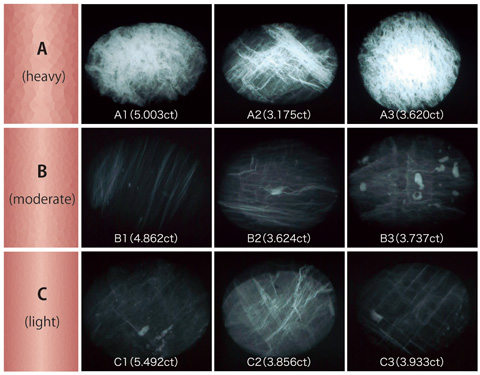
¬Ý¬Ý About 20 pieces of ruby assumedly filled their fissures with lead-glass in heavy degree that are currently on the market were tested. They were observed through the DTC-DiamondView TM (figure 2) to be classified into three groups of A (heavy), B (moderate) and C (light) according to the degree of filling for convenience. Observation of UV fluorescence figures on the DTC-DiamondViewTM can tell how the lead-glass is distributed on the surface by various intensity of fluorescence so that the stones can be quickly sorted out.
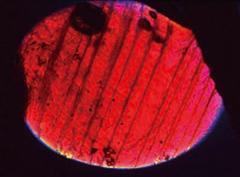
¬Ý¬Ý In the fluorescent figures of group A, thick bands corresponding to lead-glass spread out in network pattern while those figures in group B and C show fine lines in certain areas (figure 3). However, every ruby in any group quenches in certain orientation under cross-nicol and fractures or twin planes running throughout the stone are observed (figure 4), which indicates that the difference between the group A, B and C simply represents the amount of lead-glass filled in a single crystal ruby.
 |
|
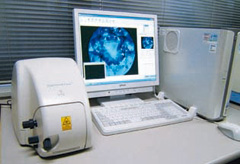
fig-2:
|
Exterior of DTC-DiamondView TM
A fluorescent pattern corresponding to growth structure of a diamond can be observed by irradiating a strong UV light on the polished surface. This instrument has been developed by DTC to determine natural or synthetic origin of a diamond by this fluorescent figure (please refer to GEMMOLOGY October 2008).
|
|
 |
|
fig-3:
|
Lead-glass distribution on the surface observed by the DTC-DiamondViewTM. Difference of fluorescence by UV shows distribution of lead-glass. A, B and C in this figure correspond to those appearing in the figures hereafter.
|
|
|
 |
|
fig-4:
|
Ruby samples of the most severely filled group under a polarising light
|
|
|
Composition analysis on the surface of cabochon dome top was performed by fluorescent X-ray and lead was detected as PbO of 13.0ÅEÅE.0 wt% in group A, likewise, about 4.5ÅEÅE.5 wt% in group B and 3.5ÅEÅE.8 wt% in group C. This result is almost consistent with the results of surface observation with the DTC-DiamondViewTM. Then the samples were tested for their X-ray transparency (X-ray exam) to confirm the degree of lead-glass impregnated inside the stone (figure 5). White veins on the photo are lead-glass, of which the areas exposed to the surface correspond to the figures observed in the UV fluorescence test. The group B and C possibly have no significant difference in the degree of filling in detailed observation, while the group A shows more white areas in general than the group B and C, and this observation is consistent with the fluorescence image that were observed as exposed areas on the stone surface. From this result the DTC-DiamondViewTM is a simple but effective means to assess the degree of lead-glass filling.
 |
|
fig-5:
|
X-ray of each group classified according to the degree of lead-glass filling
|
|
|
|