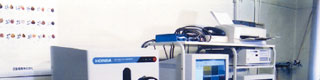
| Observation on an X-ray analytical microscope What is an X-ray analytical microscope? The most widely used instruments to observe the structure of rocks, minerals and gemstones are an optical microscope and a polarising microscope. It is usually easy to observe change of crystallographic orientation in optically anisotropic crystals by an optical microscope, however, with optically isotropic material (belonging to cubic crystal system) such as diamond and garnet, it is difficult to determine the crystallographic orientation. �@�@An X-ray analytical microscope detects fluorescent X-ray generated from a sample by an energy dispersive detector to obtain component or composition mapping of a substance (Fig 12a). A mapping of crystallographic orientation can be obtained using diffracted X-ray generated from a crystalline sample. To obtain such diffracted X-ray, employ a specially designed stage that can rotate a sample 360 degrees horizontally with �}30 degrees inclination to the incident X-ray so that a target crystal grain can be adjusted to the diffraction condition to collect a mapping of crystallographic orientation (Fig 12b). The instrument used for this study has been jointly developed by Graduate School of Science Kyoto University and Rigaku AiharaSeiki Co. (Shimobayashi et al, 1999).
Results of Observation Fig 13 shows spectral analysis of the sample A by an X-ray analytical microscope. Peaks of diffracted X-ray on 111, 222, 333, 444 and 555 reflection on the sample A that were obtained by rotating the stage of the instrument are shown from R1 to R5 respectively.
Pictures of Fig 14 (a, b and c) are mapping figures of crystallographic orientation with their diffracted X-ray being set to reflection of R2, R3 and R4. Pixel count 256 �~ 256 was selected for the mapping. In a diffracted X-ray mapping figure (14a) using 222 reflection of R2, sector boundary coinciding with the difference of light/dark contrast is detected, and this corresponds to green-yellow fluorescent area on a luminoscope or smooth {111} faces observed on the SEM-CL. R3 and R4 have the most strongest diffraction intensity and their excited regions became extremely deep. This produces clearer mapping in depth direction, which reveals that interface of smooth {111} faces is not stable at the same position but becomes wider towards the depth direction. From this mapping figure of crystallographic orientation, it is presumed that growth sectors have been changed throughout the crystal and thus the crystal has not grown static. The mapping figure of the crystallographic orientation is information on one cut-plane, however, three-dimensional transition of growth sectors can be obtained by polishing the crystal face in depth direction.
�@�@An R2 mapping figure of the sample B by diffracted X-ray at 333 reflection, and R1 and R2 mapping figures at 400 reflection and 800 reflection are shown in Fig 15 and Fig 16(a and b) respectively.
Fig 17 shows spectral analysis at 400 and 800 reflections. The diffracted X-ray mapping figure using 333, 400 and 800 reflections of the specimen shows light tone uniformly throughout the crystal with smooth interface between {111} and {100} crystal faces, in which each crystallographic orientation are arranged in the same direction, so that no boundary of growth sector is observed. This crystallographic orientation mapping of a synthetic diamond gives quite different impression compared to that of the natural diamond sample A. Growth form caused by a combination of {111} and {100} faces are controlled directly by growth condition (supersaturation) and this will cause difference in morphology.
Summary One of the basic concepts in distinguishing between natural and synthetic diamonds is a difference in morphology, however, some natural diamonds show morphology of crystal resembling that of synthetic diamond and it is called `centre cross'. In distinguishing these materials, traditional standard gemmological identification tests such as observation of colour zoning under a gemmological microscope or observation of UV fluorescence are not effective enough to distinguish them positively. They hold a potential to draw an important misjudge, because both natural and synthetic diamonds show uneven colour distribution originates in sector zoning, as well as cross-shaped patchy fluorescence caused by the sectors that can be observed under the ultraviolet light. However, distinctly different growth history of these two materials can be recognised as visual patterns by observation with cathode luminescence. Also observation by an X-ray analytical microscope can produce distribution mapping of detailed crystallographic orientation, which enable their distinction. Acknowledgement We express our gratitude to Department of Geology and Mineralogy, Kyoto University, for giving us an opportunity of analysis on an X-ray analytical microscope. We also extend our gratitude to Dr. Hisao KANDA of National Institute for Materials Science for his cooperation on observation of CL figure on an electronic microscope. References: F.C. Frank: Proc. Int. Ind. Diamond Connf.Oxford, 1996, J.Burls(ed.), 1, `science', Industrial Diamond Information Bureau, London, pp. (1967) 119-135. S.Tolansky and I.Sunagawa: Nature, 184 (1959) 1526-1527. N. Shimobayashi., J .Minato., M. Kitamura. (1999): Earth and Planetary Science using Synchroton Radiation, KEK proceedings. 99-14, 83-86. Masao KITAMURA, Norimasa SHIMOBAYASHI. (1993). New Diamond. No.3, Vol.9, 8-13. |
||||||||||||||||||||||||||||||||||||||||||||||||||
|
||||||||||||||||||||||||||||||||||||||||||||||||||