RESULTS AND DISCUSSION
Table 1 shows the result of analysis by LA-ICP-MS and XRF. The Anodonta nuclei from freshwater bivalve Unionidae and the Tridacna nuclei from saltwater bivalve Tridacnidae contain trace elements such as Na, Mg, Si, S, P, Cl, K, Mn, Fe, Ga, Sr and Ba other than their main component CaCO3. Ultra trace elements such as Li, Ti, Cr, Co, Ni, Cu, Zn, Ag, Sn and Pb are also detected. Alkali metals Na and K, alkaline earth metal Mg and Sr and semimetal-nonmetal P, S and Cl (refer to XRF), which are contained in the saltwater Tridacna nuclei, show higher value than the freshwater Anodonta. On the other hand, concentration of heavy metals such as Mn, Fr, Ga and Si, Ba in the Anodonta nuclei tends to be higher than saltwater Tridacna nuclei. Contents of ultra trace elements such as Li, Ti, Ag and Sn in saltwater Tridacna tend to show slightly higher values, but elements such as Cr, Co, Ni, Cu, Zn and Pb do not show significant difference. In chemical compositional analysis by X-ray fluorescence, detection of Mn is characteristic to pearls and shells from freshwater while higher contents of Sr is characteristic to pearls and shells from saltwater, thus distinction between the two materials becomes easy. However, distinction of pearls and shells containing a few amounts of such elements requires analysis on elements such as Na, Mg, Si, Fe, Ga and Ba by LA-ICP-MS method as the indication.
Chemical compositional ratio of Sr/Mg and Mn/Fe between the Anodonta nucleus and the Tridacna nucleus by LA-ICP-MS analysis is shown in Fig 3. The Mn/Fe ratio in the saltwater Tridacna nuclei range almost under 0.1 and the Sr/Mg ratio range over 6.0. Contrary to this, the freshwater Anodonta nuclei show higher Mn/Fe ratio (over 20) and slightly lower Sr/Mg ratio than the Tridacna nuclei. Thus this distribution chart makes these materials for pearl nuclei possible to be clearly distinguished from each other.
|
|
| Fig.3ÅF |
Chemical compositions distribution chart of the Anodonta nuclei, the Tridacna nuclei and cultured Akoya pearls. |
|
|
Chemical composition of surface layer of cultured Akoya pearls from Ehime pref. in southwest of Japan using the Anodonta nuclei and from Hainan in coastal area of China using the Tridacna nuclei were analysed by the two instruments described above. As you can see in the results of chemical analysis on the Akoya pearls in Table 1, contents of chemical components show only a few differences between the saltwater Akoya pearls from both localities. The Akoya pearls using the Chinese Tridacna nuclei tend to show slightly higher contents of SO4, Mg, Sr and Ba, while the Akoya pearls using the Japanese Anodonta nuclei show higher contents of Na, Cu and Zn. Compared to the Anodonta and Tridacna nuclei, trace elements unique to Akoya pearls such as Cu and Zn are concentrated. Chemical compositional ratio of Sr/Mg and Mn/F in Akoya pearls are clearly distinguished from the two nuclei materials (Fig 3), but distribution range of Akoya pearls with the two nuclei materials are plotted in the almost same area, therefore the combination of the contents of trace elements in the pearls from both localities described above will possibly help to distinguish them.
| Specimen |
. |
Fresh water bivalve shell-Anodonta nucleus |
. |
Salt water bivalve shell-Tridacnitae nucleus |
Japanese Akoya pearl with Tridacnitae nucleus |
. |
Chinese Akoya pearl with Tridacnitae nucleus |
| Variety wt% |
CaCO3 |
97.73-98.42 |
. |
96.14-97.40 |
96.03-96.73 |
. |
96.03-96.88 |
Trace Elements
(ppm) |
Na |
9980.75-12379.48 |
 |
17913.52-25156.12 |
20308.55-24646.05 |
 |
17224.87-21008.70 |
|
Mg |
255.84-00324.85 |
|
581.43-1289.61 |
855.82-967.66 |
|
1225.82-1917.62 |
| Si |
1122.34-2353.83 |
 |
724.64-1150.77 |
863.45-913.59 |
 |
743.21-879.39 |
| Li |
0-0.11 |
|
0.86-2.11 |
4.24-8.05 |
|
0.69-01.53 |
| SO4 |
110.23-488.29 |
|
448.65-1082.53 |
4232.14-4661.35 |
|
5688.84-5846.09 |
| P |
36.57-55.11 |
|
96.66-132.97 |
75.86-98.32 |
|
88.25-129.50 |
| Cl |
176.51-230.34 |
|
406.13-613.62 |
653.74-996.21 |
|
524.67-1052.18 |
| K |
81.32-133.59 |
|
142.42-265.91 |
162.63-207.65 |
|
147.51-261.14 |
| Ti |
0.54-3.60 |
|
1.27-22.36 |
0.10-2.17 |
|
0.37-6.83 |
| Cr |
2.91-5.16 |
|
2.51-3.43 |
1.07-3.36 |
|
- |
| Mn |
1778.43-5839.04 |
|
0.77-7.31 |
3.01-17.18 |
|
0.10-6.83 |
| Fe |
58.75-109.36 |
|
19.60-67.75 |
48.63-60.43 |
|
46.71-78.18 |
| Co |
3.64-7.56 |
|
3.24-3.83 |
0.84-0.97 |
|
0.65-0.80 |
| Ni |
5.35-10.42 |
|
7.41-10.48 |
4.18-5.35 |
|
3.85-4.38 |
| Cu |
0.94-3.18 |
|
1.29-7.19 |
48.01-192.55 |
|
30.21-65.66 |
| Zn |
1.36-5.37 |
|
0.93-23.21 |
15.53-214.34 |
|
4.94-34.54 |
| Ga |
11.54-44.99 |
|
0.72-1.28 |
0.02-0.11 |
|
0-1.20 |
| Sr |
1722.53-2397.78 |
|
6420.83-8658.63 |
5435.70-6385.24 |
|
5466.02-8320.93 |
| Ag |
0.30-0.62 |
|
0.94-1.30 |
0.77-0.86 |
|
0.12-0.27 |
| Sn |
1.52-2.05 |
|
1.62-9.47 |
2.16-6.73 |
|
0.87-1.46 |
| Ba |
183.08-674.66 |
|
5.97-34.97 |
2.04-3.30 |
|
3.88-57.11 |
| Pb |
0.32-2.09 |
|
0.37-1.17 |
7.59-9.97 |
|
3.97-11.65 |
| H2O |
Uncalculated |
. |
Uncalculated |
Uncalculated |
. |
Uncalculated |
| Table1ÅF |
Concentration (wt%-ppm) of main elements and trace elements in pearl nuclei made of bivalve shell and in Akoya pearls by LA-ICP-MS and XRF. |
|
The cultured Akoya pearls using the both nuclei materials above are examined by X-ray transparency equipment (Softex C60) to confirm existence of nuclei within the nacre and to confirm the thickness of the nacre and nuclei, and the radiographs are shown in Photo 3. Akoya pearls of both materials appear evenly white overall in high relief with slightly dark periphery. This indicates the existence of uniform body of CaCO3 compound, and circular thin streak corresponds to distribution of nuclei, nacre and the boundary of them. Cultured Akoya pearls using the Anodonta nuclei, left on the photo, show thicker diameter of the nuclei and nacre compared to the Tridacna pearls.
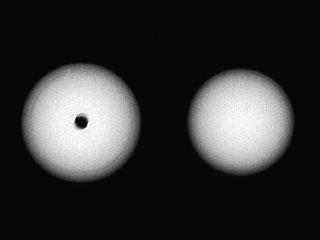 |
| Photo.3: |
A radiograph. Circular thin streak on the periphery of a pearl corresponds to distribution of a nucleus, nacre and their boundary. |
|
|
After the existence of nuclei was confirmed, LA-ICP-MS was used to identify the material by irradiating continuously a laser beam from the pearl surface towards inside. Shown in figure 4 and 5 are spectrum lines of laser irradiation between the pearl surface and nuclei. Spectrum lines of Mn contained in freshwater Anodonta are detected from the nuclei of cultured Akoya pearls and spectrum lines of Sr are detected from the nacre of Akoya pearl in Fig 4, while Sr is detected from freshwater Tridacna nuclei contained in Akoya pearls in Fig 5. In this way, LA-ICP-MS analysis can identify the material of nucleus by the irradiated laser that penetrates from the surface of nacre to the internal nucleus.
With the contents and types of chemical trace elements detected by these compositional analyses above, nacre and nuclei can be determined whether they have been formed in the lake environment or in the ocean environment.
 |
. |
 |
| Fig.4ÅF |
Spectrum lines of Mn, which was detected in Akoya pearls, contained in the freshwater Anodonta nuclei, and spectrum lines of Sr contained in nacre. |
|
|
| Fig.5ÅF |
Spectrum lines of Sr that was detected in nacre of Chinese Akoya pearl, and spectrum lines of Sr detected in the internal saltwater Tridacna nuclei. |
|
REFERENCES:
Monthly Pearl News 2003, 12, No.145.
Monthly Margarite 2004, 8, No.153. |