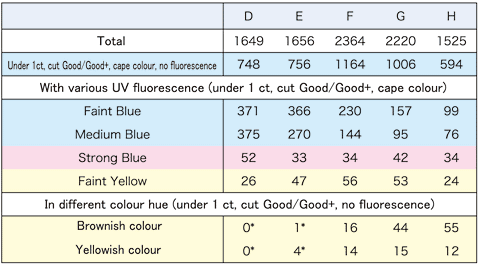
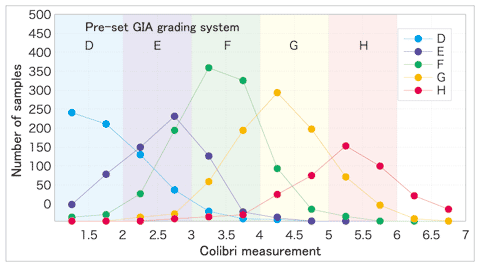
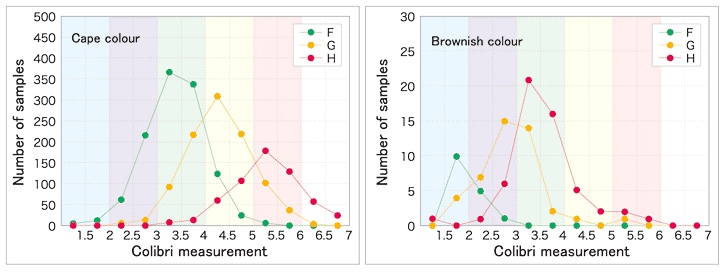
| ◆Reliability of colour grading ??Among the 14,000 diamonds that were tested in this study, 1649 pieces were graded at our laboratory as D colour, 1656 pieces as E, 2364 pieces as F, 2220 pieces as G, 1525 pieces as H and less than 1000 pieces with lower than H grade (Table 1). The number of the samples measured in each grade of H colour or over was more than 1,000. We regarded this amount sufficient for statistical work and analysing. All of these diamonds analysed had been confirmed to be type I. ??The most common diamonds seen during our routine grading work were round brilliant-cut, under 1 carat with cut grade Good/Good+ (75% of the 14,000 diamonds tested above). 4,268 diamonds that were graded as cape colours with no fluorescence were found suitable for the study, and were therefore measured on the Colibri? to indicate the reliability of the instrument. Of the 4268 diamonds tested, 748 pieces were graded as D colour at our laboratory (about 45% of all stones graded as D), 756 pieces graded as E colour (45% as above), 1164 pieces as F colour (49%), 1006 pieces as G colour (45%) and 594 pieces as H colour (39%) (Table 1). ??The measurement was performed on each group of diamonds graded the same colour at our laboratory, as shown on the histogram with the measurement values at 0.5 intervals (Figure 6). The histogram shows distribution of the frequencies and the graph represents a number of samples that have values that fall in a certain range. On the diagram, abscissa axis represents a measured value on Colibri? and ordinate axis represents a number of samples that showed the values in the range. For example the stones graded as F colour at our laboratory: among the total 1,164 pieces, 367 stones showed measurement values between 3.01 an 3.50 on the Colibri? and 337 stones showed the values between 3.51 and 4.00. This means that 704 pieces in total were measured as F colour (values between 3.01 and 4.00) on the pre-set GIA grading system. As shown on the diagram, a distribution of the results of the diamonds graded as the same colour at our laboratory makes a gentle curve with one peak. Each peak of the distributions falls in the range of values corresponding to the colour grade of pre-set GIA system, and 55-70% of the stones measured are included in the range. Estimate the error on Colibri™ ±1/2 and extend the effective width ±1/2 over the original, then more than 80-90% of measured diamonds fall in the range. For example, about 60% (704 pieces) of diamonds graded as F colour (1,164 pieces in total) fall in the range between 3.01 and 4.00 and about 90% (1,047 pieces) show the values between 2.51 and 4.50. Taking into account that each colour essentially has a certain range, and it is highly possible that natural diamonds in cape colour might contain a slight amount of hue, we can conclude that the results above are accurate enough for practical use.
|
||||||||||||||||
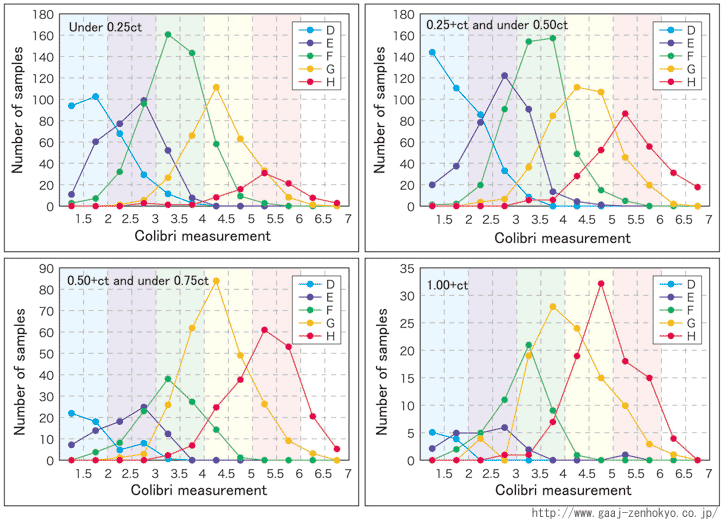
| ◆Differences due to diamond characteristics When measuring colour in a diamond, light path differs according to the size or cut of the stone, which may influence the result. The Colibri™ allegedly specialises in cape colour diamonds and variations of hue or fluorescence in each diamond are expected to affect the measurement. We studied how the variation in weight, cut, hue or fluorescence actually influences the measurement results. 1. Weight Previously the stones under 1 carat were measured as one group, but here the stones were separated in groups according to size: under 0.25, 0.25 - 0.50, 0.50 - 0.75 and 0.75 - 1.00 ct in order to confirm any differences in the measurement results derived from the weight variation. The stones over 1 carat in cape colour without fluorescence were similarly measured to be graphed in a histogram. The result indicated that the stones under 1 carat showed no differences among different weight groups (Figure 7). Stones over 1 carat in E or F colour showed characters similar to those under 1 carat stones, but those in G or H colour had a tendency to show slightly smaller numeric values (about 0.5 points). This means it shows better colour grade. According to the data accumulated to date, considering the error of Colibri? ±1/2, this gap may be regarded as error margin.
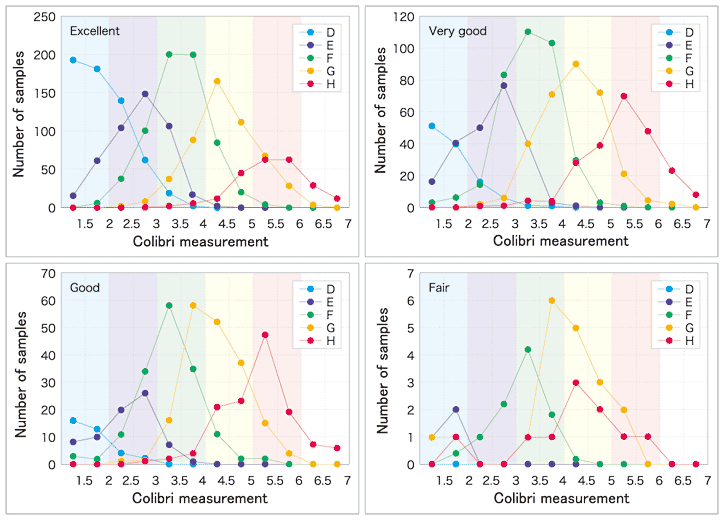
2. Cut grade The round brilliant cut diamonds tested above with cut grade Good/Good+ were divided in groups according to the cut grade to make a histogram of each group. The results showed no significant differences in groups of cut grade from Excellent to Good (Figure 8). Some pieces with Fair cut grade showed values out of the general tendency. However, considering the small amount of such stones to be brought in for daily grading work (about 1% of total pieces), the reliability of the Colibri? remains high for round brilliant cut- diamonds.
3. Hue Round brilliant?cut stones under 1 carat with no fluorescence and cut grade Good/Good+ in colours other than cape series were measured and histograms were made accordingly. The diamonds measured were determined by diamond graders to be containing brown hue (16 of them were graded as F colour; 44 as G colour and 55 as H colour) or gray hue (likewise, 14 as F colour; 15 as G colour and 12 as H colour) (Table 1). Those with brown or gray hue and graded as D or E colour were less than 10 pieces, thus they were excluded from this test. The result indicated that diamonds with brown hue tend to show better colour grade than stones in cape colour (Figure 9). This result is understandable as the Colibri? detects mainly intensity of cape colour in a diamond. Detailed observation of the histogram shows that those of F colour and lower grades have peaks that are shifted at 1.5-2.0 points towards smaller numeric values. Consequently, diamonds with brown hue, presumably, should be corrected by adding 1.5-2.0 points to the numeric value measured on Colibri? to be closer to the true numeric value. Similarly, the diamonds with gray hue tended to show 1.5-2.0 points smaller numeric values on Colibri? than the expected values of colour grade determined at our laboratory.
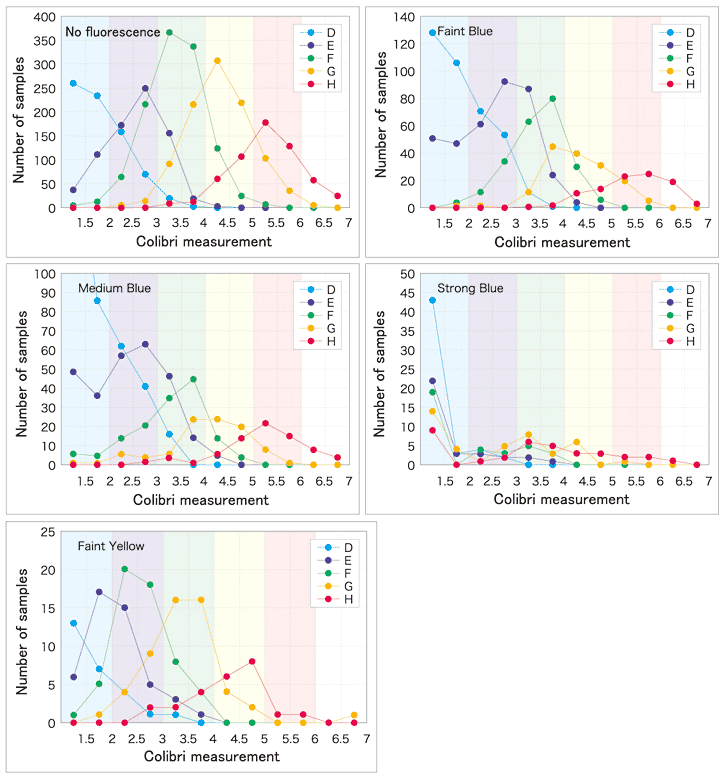
4. Fluorescence Round brilliant cut-stones under 1 carat in cape colour with cut grade Good/Good+ that show UV fluorescence were measured to make histograms. In this study, the intensity of the UV fluorescence was not as measured on Colibri? but determined by graders. The number of the diamonds measured and analysed are shown in Table 1. In the result, the stones with Faint Blue and Medium Blue fluorescence showed almost the same values as stones without fluorescence. Nonetheless, the diamonds colour-graded with better grades tend to be affected by fluorescence. Especially in the case of stones graded as E colour, many diamonds with Faint Blue or Medium Blue fluorescence often showed values around 1.5 while others showed the original values between 2.0 and 3.0 (Figure 10). As for those with Strong Blue fluorescence, peaks on histograms of all colour grades were confirmed to shift significantly towards the smaller numeric value. In this case, many stones regardless of their colour grades show values close to 1.5 and it is not possible to presume accurate value by correction. As for the diamonds graded as D colour at our laboratory, the centre of the histogram peaks remain within the range of D colour of pre-set GIA system because Colibri? does not show values lower than 1.5. As for stones showing Faint Yellow fluorescence, those colour-graded between E and H at our laboratory were proved to have tendency showing 1 to 1.5 point smaller numeric values than the grading result at our laboratory. This means that the results on Colibri™ indicate a better grade than actual colour grade. Hence the result should be corrected by adding 1 to 1.5 points to the measurements to obtain more accurate numeric values. As for those with Strong Blue fluorescence, graded as D colour at our laboratory, the centre of the histogram peaks remain within the range of D colour of pre-set GIA system
|
||||||||||||||||
| ◆Summary ??From the results above, it was confirmed that Colibri? could provide consistent measurements for colour grading of diamonds. Furthermore, after measuring about 14,000 diamonds on Colibri? it was revealed that effective measurements can be expected when a stone is 1. under 1 carat, 2. round brilliant-cut with cut grade Good/Good +, 3. in cape colour and 4. no fluorescent or up to Medium Blue. Especially for those with no fluorescence, more than 80% of the total fall in the error range ±1/2, thus more accurate measurements become possible. Among the 14,000 diamonds analysed this time, 70%. meet the conditions 1. to 4. above. From these results, the measurement value by Colibri? may be regarded as an objective guide for colour grading. Moreover, the stones in colours other than cape series with brown or gray hue, their colour grades may possibly be estimated by correcting the values on Colibri™ by adding 1.5 to 2.0 points to them. Though the diamonds showing Strong Blue fluorescence give extremely smaller numeric values on Colibri™ that is beyond a limit for correction, and cannot be measured on the instrument, the effective range for Colibri™ measurement in general will be quite wide. However, the Colibri™ should be properly operated based on a full understanding of its tendencies described above, because diamonds showing a same colour grade have a range of values. Our laboratory will continue our research to learn more precisely about the Colibri™ characteristics by accumulating data, measuring various diamonds such as shapes other than round brilliant, in size over 1 carat or in lower colour grades. For further information, please contact: GAAJ-ZENHOKYO Laboratory E-mail: laboratory@gaaj-zenhokyo.co.jp |
||||||||||||||||
|
|
