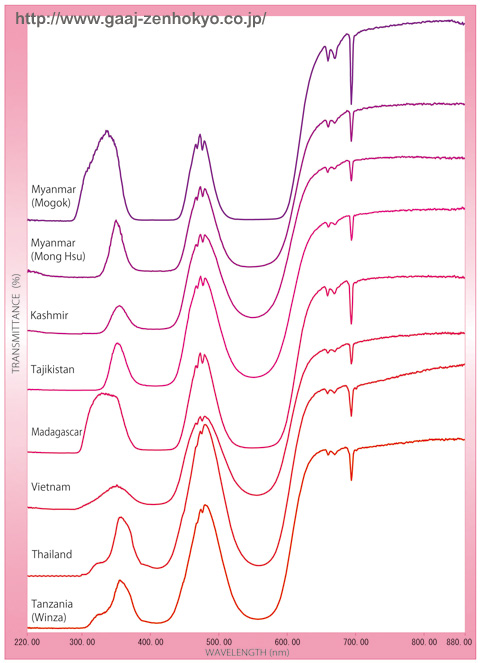
| 2. UV-Vis-NIR Spectral Analyses @@@UV-Vis-NIR spectra of representative rubies with non-basalt and basalt related origin are shown in figure 1. Similar to the rubies from localities of non-basalt related origin stated above, the eWinzaf rubies showed no absorption between 860 and 700 nm, but sharp absorption around 700`650 nm originated in an element Cr (Chromium) as well as broad absorption centred at 550 and 410 nm were recognised. In UV region, a shoulder absorption was detected on 325 nm, which reveals that the eWinzaf rubies were rich in Fe (Iron) similar to rubies from Thailand. These characteristic absorptions are hardly seen in rubies from Myanmar. |
||||
|
||||
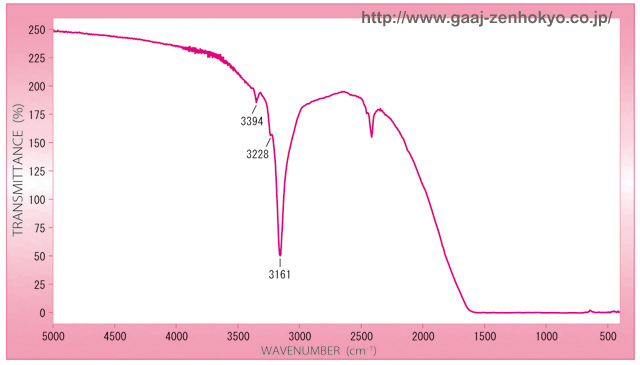
| 3. Infrared Spectral Analysis @@@Typical infrared spectra of the eWinzaf rubies are shown in figure 2. All the twenty pieces tested showed absorption on 3394 cm-1 and 3228 cm-1 as well as a very strong absorption centred at 3161 cm-1. These absorptions are assumedly derived from combination vibration of Si+4 (Silicon ion) or Mg+2 (Manganese ion) and hydroxyl OH (Smith, Full 2006. Gems&Gemology). These absorptions are often observed in unheated Sri Lankan yellow sapphire, padparadscha sapphire or blue sapphire. This feature will be useful to distinguish the material from rubies from other non-basalt related origin. |
||||
|
||||
| 4. Fluorescent X-ray and LA-ICP-MS Compositional Analyses Fluorescent X-ray compositional analysis detected Cr, Fe and Ga (Gallium) other than the main elements Al2O2 (Aluminium oxide). However, trace elements such as Ti (Titanium) and V (Vanadium) were below the detection limit. Cr2O3 (Chromium oxide) and Fe2O3 (Iron oxide) were detected about 2000`5000 ppm and 3000`4500 ppm respectively and so was Ga2O3 (Gallium oxide) about 20`60 ppm. Fe content in the eWinzaf ruby was much higher than that of rubies from every non-basalt related origin (Myanmar: Mogok and Mong Hsu, Kashmir, Tajikistan, Madagascar and Vietnam), but slightly lower than Thai rubies with basalt related origin. The content of Ti, V and Ga, on the other hand, was greater in non-basalt related origin than the eWinzaf rubies. Trace element analysis using LA-ICP-MS was performed on five pieces of the samples and the trace elements such as Mg, Ti, V, Cr Fe, Ni (Nickel) and Ga were detected besides the major element Al. The elements contained, from the highest concentration, were; Fe (2000-3000 ppm), Cr (1100-1400 ppm), Mg (30-70 ppm), Ti (20-40 ppm), Ga (10-25 ppm), and Ni and V were below 4 ppm. (In one of five pieces V was not detected.) A colouring trace element Iron (Fe) was contained the most in the eWinzaf rubies with non-basalt related origin, while concentration of Ti was very low, therefore orange tint was presumably expressed strongly. Compositional feature in the eWinzaf rubies resembles rubies from Umba in Tanzania that are produced by metasomatism and both exhibit high Fe low V combination. However, concentrations of Ti, V and Ga are rather higher in Umba rubies. |
||||
|
♦ Summary
The rubies from Winza in Tanzania, newly discovered early this year, include some gem quality large pieces. The colour contains little blue tint comparing to common rubies and this unheated colour attracts high expectation of the future in the gem market. Although its geological background is still unknown, the eWinzaf rubies is presumed from non-basalt related origin by the combination of the unique inclusions, UV-Vis-NIR spectral pattern, characteristic spectrum absorption by FTIR and trace elements detected. These test methods above can also be used to identify characteristics of origin for the eWinzaf ruby. |
||||
|

