|
♦ Laboratory Techniques
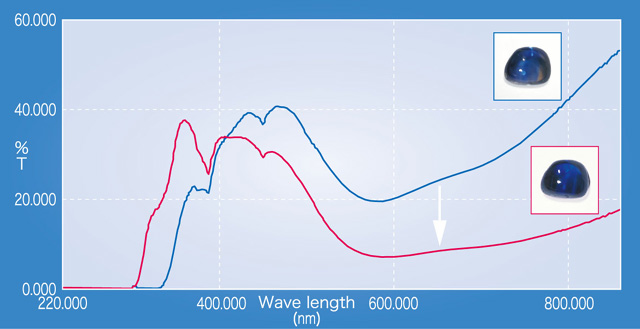
ź Features in UV-Visible range spectral analysis When colour of a stone is improved by heating process, spectra in UV-visible and infrared region will change. In particular, when geuda stones from Sri Lanka or Madagascar are heated their spectra tend to show deeper absorption in yellow and better transparency in UV region (figure 9).
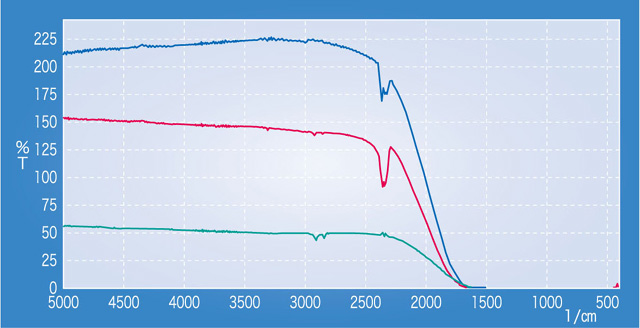
ź Features in infrared spectral analysis (FTIR) Unheated blue sapphires with non-basaltic origin such as from Sri Lanka, Myanmar or Madagascar show no characteristic absorption in infrared region (figure 10).
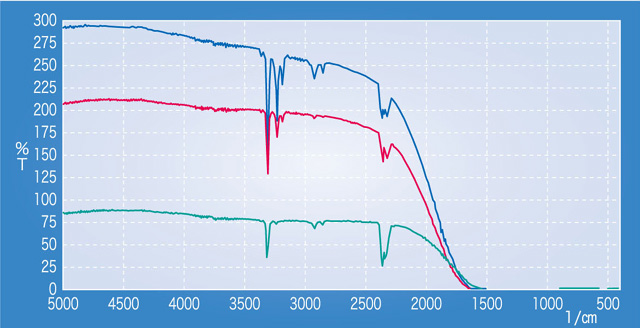
Contrary to this, blue sapphires with basaltic origin such as from Thailand, Cambodia, Australia or China show absorption around 3000ü`3500cm-1 that is related to OH group (hydroxyl) (figure 11).
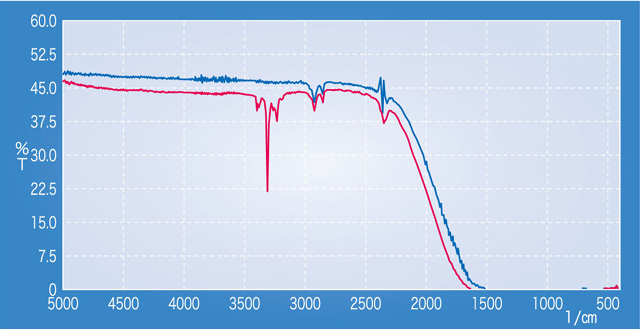
Blue sapphire of non-basaltic origin that was heated in reducing atmosphere shows absorption originates in OH group after heating, which was not seen before the heating (figure 12).
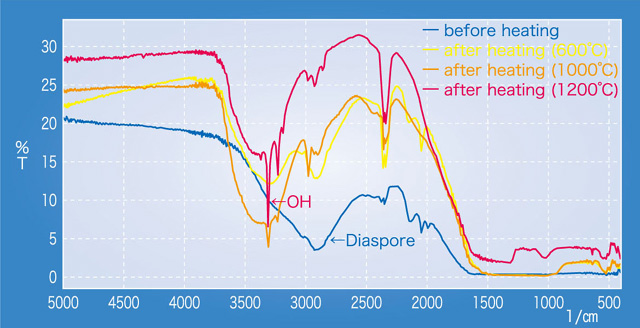
On the other hand, when blue sapphire of basaltic origin showing OH-related absorption is heated in oxidising atmosphere, the peak derived from OH disappears. Thus, FTIR analysis on blue sapphire becomes extremely effective for identification of heated / unheated status when the approximate locality of the stones is already known. In unheated ruby from Mong-Hsu district, absorptions by included diaspore are often observed. They started to disappear gradually by dehydration reaction during heating, while absorptions of OH that is bonded in the structure start to appear at 1000 ºC or over. From this fact, rubies from Mong-Hsu district showing distinctive OH peaks can be determined as heated (figure 13).
|
||||||||||||||||||||
|